Faulty dice: frequentists vs. Bayesians

If you’ve read a few blogs or articles on machine learning, data, analytics, or any field related to statistics, you may have come across the terms “frequentist” and “Bayesian”. These terms refer to two different approaches to statistics that, on the surface, seem to be in conflict with one another.

Even after doing a bit of research, it may not be clear to you what the difference is. It wasn’t clear to me. I started to suspect it’s just another mathematicians’ nerd-war over nit-picky details.

Turns out, the difference between the two approaches goes deep, and reflects the assumptions behind the decision we make in everyday life. I’ll try to explain this difference with an example that you might be familiar with.

The normal die

dice

(Note: “die” singular -> “dice” plural)

Suppose you rolled a normal six-sided die. How likely are you to roll a 2?

Most of us would answer this question by looking at the number of sides on the die (in this case, six) and assume it has an equal chance of turning up any of the sides. There are six sides, one of the sides is a 2, so roughly one out of every six times you rolled you’d get a 2.

This thinking seems intuitively correct. If I had to bet money on these dice rolls, I’d have a rough idea of how much money I’d lose or win over time based on the number of sides the die had. If 5 of my friends and I were betting on the outcome of the roll, and we each had to pick a side to bet on, unless I were superstitious (or suspected my friends of cheating) I’d have no practical reason to pick one number over any of the others.

The faulty die

dice
A faulty die. Looks the same, doesn’t it?

What if I told you now that when the die was being made in the factory, it was made faulty? Not intentionally, mind you; these aren’t cheater’s dice. They’re just weird, irregular.

Now, if I asked you what the odds are that any roll would turn up a 2, what would your answer be?

This question feels harder to answer than the first one. The die may be weighted to one side or another, so some sides may never turn up, and others may turn up more than half the time. The assumptions we made when talking about the normal die no longer apply.

If I pushed you for an answer, the only way you could guess is by rolling the die a few (hundred?) times, and keeping a record of how often each number comes up. Then you could give me a good sense of how likely I am to roll a 2.

The catch

Here’s the catch. If I gave you a die, how could you know if it was faulty or not?

In other words, given any unknown die, how could you decide if it was well made, or if it was imbalanced?

There’s no easy way to answer this. Our common intuition is to roll the die a few hundred times and keep a record of how many times each number is rolled. From the results we can see if the die is weighted towards one number or another.

But there’s a problem with that approach. Even if you roll a perfectly balanced die you won’t roll all 6 numbers evenly. You could easily roll five 6s in a row.

I have a die next to me. These are my first 10 rolls:

1, 5, 2, 1, 3, 5, 6, 6, 5, 3

I didn’t roll any 4s, and I rolled 5 three times. You can try this experiment yourself at this link.

Some would argue that ten rolls isn’t enough to decide if a die is faulty. You’d need at least a few dozen rolls, if not more, to feel confident.

But no matter how many times you roll the die, you will likely never get a perfect 1/6th split. It may get very close, but it won’t be exact. This is a natural result of the fact that the world has randomness in it. Given that’s the case, how can you know if these variations were because the die was faulty, or if it was due to luck?

Even a tiny margin, say 1%, can make a difference over the long run. For example, a gambler who is playing with weighted dice, where the number 5 is slightly more likely to be rolled than other numbers, could use that knowledge to her advantage and make a profit. Casinos use this information to give them a small edge, which, in the long run, adds up to massive (and legal) profits.

Frequentists and Bayesians

So we’re stuck in a dilemma. There is no real way to differentiate between results that are caused due to randomness, or results that are actually a consequence of how the die was made.

In cases like these, we tend to go with our common sense. Consider the following two scenarios:

If you get a die out of a brand new board-game box, you have no reason to believe it is fraudulent or faulty. If you rolled one a few times, and 6s came up more often than 3s, you’d attribute it to luck. This is the Bayesian approach, which says that you can guess beforehand what the outcomes (“probabilities”) are going to be based on certain rational criteria and experiences. In this case, new dice always roll each of the six numbers evenly, with a bit of randomness thrown in to spice things up. It’s only when you get new information, such as news of a fault in the factory, that you readjust your predictions.

On other other hand, if you hang out with gamblers and magicians, and one of them handed you a die, you’d probably want to check it beforehand. If you rolled it a few times, and 6s came up more often than 3s, you might accuse the person who handed it to you of cheating. This is closer to the frequentists position; it says that every new die is a new experiment, and must be experimented with on its own terms. Even after the experiment, the frequentist will only talk about the history the dice has shown thus far, and leaves open the possibility that it will change in the future.

Ultimately, there is no universal way to know what caused the dice to roll one way or another, so neither approach is applicable in all cases. It’s up to you to decide in a given situation which seems most appropriate.

When this difference matters

If you had to guess which of your country’s political parties was going to win the next election, how would you make that guess?

One approach is to go by past success. If a particular fringe party has never won, it seems reasonable to assume that they won’t win this time either. This is the Bayesian approach; if every new election is like rolling a new die, you have no reason to suspect any of them is faulty until new information (like a shift in political zeitgeist) is added to the mix.

Consider, however, there haven’t been that many elections in any given country’s history. The political parties who have won may have done the equivalent of rolling 5 sixes in a row, and this assumption is not impossible. Your decision that a certain fringe party is unlikely to win is a judgement call you make based on past experiences, and a gut feeling.

Alternately, you may decide to poll pedestrians on the street and generalize your sample to the entire population. This is the frequentist approach. Every new election, like every new die from a gambler, has to be experimented with separately, to see what the outcome is.

You could even imagine yourself taking both approaches in different contexts, and that is the point. Though the two approaches contradict each other in some ways, in other ways they can be seen as complimentary. They serve different use cases. You have to decide in each case if you’re going to start from prior probabilities, or if you’re going to do a tally of the current use case, and only go by the result.

How we enable in-store purchases using crypto

Background: STACK has partnered with STK to provide a cryptocurrency wallet inside the existing STACK app.

STACK + STK (1).png

STK lets you make instant payments at points of sale directly from your cryptocurrency wallet. Now you can add your cryptocurrency wallet alongside your other currency wallets in STACK. When you tap to pay through the STACK app, you can make purchases at any retail location that supports credit or debit cards. STK opens a bridge between the Ethereum blockchain and traditional credit card payment rails.

Almost a decade after the introduction of cryptocurrencies, and despite their promise of immense profit, none of the established payment providers have rolled out a convenient way to pay at stores or online with Bitcoin or Ether. In this article I’m going to explain the challenges of creating a cryptocurrency payment protocol at point of sale, and how we resolved them.

Traditional payment rails

Most of the world’s retail transactions (shopping), as well as banking go through a handful of core payment rails. The best known of these rails are run by major credit card companies. They enable banks and other financial institutions to transmit money to each other, securely and reliably.

Yervant Diagram 1.png

At STK we focused on consumer-to-retail payments, like those you make at grocery stores, convenience stores, restaurants and other retail locations.

Continue reading “How we enable in-store purchases using crypto”

Understanding Blockchains Intuitively, part 2

This is part two of an ongoing set of articles, designed to help you understand the motivations and concepts behind blockchains, in an intuitive and non-technical way. You can read the first part here.

To briefly recap, there is an island in the Pacific called Yap, whose inhabitants, rather than holding their money in their pocket, simply agree amongst each other how much money each person has, and update these records every time a sale or transaction is made. This provides a good analogy for blockchains. In modern blockchains, computers the network connections between them stand in place of the islanders of Yap.

Contracts

No discussion of blockchains would be complete without explaining Smart Contracts. The most popular Smart Contract blockchain in use right now is Ethereum, a blockchain similar to Bitcoin but with an added twist. To help explain this twist, let’s return once again to our inhabitants of Yap.

Peering into the brain of one of the Yapese we can see a long history of transfers of stone coins. These go in order, starting from the oldest that he or she remembers up till the most recent.

SmartContract (3)

One day, this islander is chatting with a friend of hers named Peter. Peter is worried about the damaging effect of annual hurricanes on his crops. He wishes to buy crop insurance to protect himself in case of disaster. Peter has therefore decided to enter into an insurance contract with another islander, Sumesh. Here’s how that contract goes:

Continue reading “Understanding Blockchains Intuitively, part 2”

Technological disruptions vs societal disruptions

The fairy-tale of technological disruption is a familiar one to us all. It is the recurring parable of our modern society. A plucky entrepreneur, filled with determination and the tiny but invincible seed of a vision, sets out to overturn our assumptions, confronts and overcomes the guardians of the decaying establishment, and brings his new gift to the world. The invention of the iPod and the iPhone, the birth of Google and AirBnB, and countless other entrepreneurial stories are enshrined this way in our culture.

If you’re involved in tech, or even peripheral to it, you’re likely familiar with the idea of technological disruption. Ever since Christensen first wrote about it in The Innovator’s Dilemma, it has been the dominant model used for analyzing new companies and emergent trends.

The pattern is typically as follows: a novel technology facilitates or makes more convenient what was previously tedious and expensive. Germinating in niche or low-end markets, and spreading though unorthodox sales channels, it eventually overtakes established industries and becomes the new norm or mode of life. Uber and AirBnb are poster children of this wave of technological revolution; but by no means the only ones.

Continue reading “Technological disruptions vs societal disruptions”

Understanding Blockchains Intuitively, part 1

This is the first part of a two part series. This part explains the basics of the blockchain through an analogy. The second part builds on this and discusses the idea of smart contracts.

There is an island in the Pacific called Yap. The people of this island have a strange and unintuitive type of money.

Yap_Islands.png

Their money consists of large stone coins called rai. Many of these coins are taller than a person. They are heavy and difficult to move. Nevertheless, these large stones are what they use as money.*

immagine-rai31.jpg

*In recent decades they have gradually moved away from using rai to using the US dollar, and the stone coins are reserved for ceremonial occasions.

How do you get your hands on, or even spend one of these coins? Your first guess might be that when you get a coin it gets shipped to your house and put in your front yard. That way you can know who owns what coin and, as an added bonus, you can make your neighbours jealous.

Continue reading “Understanding Blockchains Intuitively, part 1”

Intuitions in Machine Learning: Bias and overfitting

We are constantly trying to predict the future. Understanding how our actions affect what will happen helps us make better decisions. Since none of us can actually see the future, we use our past experience to make connections between two or more events, then use that to predict what will happen.

For instance, the open screen door seems to be connected to flying bugs coming into my house:

Screen Shot 2017-06-18 at 10.40.45 AM.png

“Hmmm… When I leave the front door open, bugs tend to fly in.”

Continue reading “Intuitions in Machine Learning: Bias and overfitting”

Intuitions in Machine Learning: Understanding ROC Curves

Have you tried to teach yourself Machine Learning online, and got overwhelmed by the first flood of mathematical terms and equations?

Screen Shot 2017-04-15 at 2.21.05 PM
What you get when you look up ROC curves and Confusion Matrices

My goal in these articles is to give you an intuition for the math, by connecting the math to your personal experience. I’ll cover Machine Learning topics through concrete, accessible examples.

I’ll start the series by covering a simple topic: ROC curves*. In this article, I’ll explain what they are, how they work, and why and when to use them. In order to explain ROC curves we’ll also cover these related concepts: Confusion Matrices, sensitivity, and specificity.

(*ROC is short for “Receiver Operating Characteristic”. This term is a holdover from when it was used in Electrical Engineering, and you don’t need to understand it to use it now.)

The Prospector

Let’s start by creating an imagined scenario. You’re a gold prospector back in the Old West. These were entrepreneurs who explored the California frontier looking for gold during the gold rush.

canstockphoto16467783
This is you.

Continue reading “Intuitions in Machine Learning: Understanding ROC Curves”

Swarm Intelligence in Jacob’s Ladder

This is the second of the series of articles about Jacob’s Ladder. The first part is about the graphics and optimization in the Live Wallpaper. This part is about the A.I. that runs the Live Wallpaper. Jacob’s Ladder is open-source on Github.

Jacob’s Ladder

Purple_cubes.gif

Jacob’s Ladder is a Live Wallpaper I used to explore a brand of Artificial Intelligence called swarm intelligence. Swarm Intelligence models how simple creatures that carry out routine behaviours can produce elegant patterns on a group level. Examples of swarms include ants building anthills, or bees coordinating a hive. Both of these groups can build complex structures without needing an overseeing architect to guide them.

Continue reading “Swarm Intelligence in Jacob’s Ladder”

Making a Live Wallpaper in Native OpenGL

Faster and More Battery Efficient

Jacob’s Ladder is open-source on Github. The Github repo also contains a base library you can use to make your own native Live Wallpaper (see below for instructions).

Making your Live Wallpaper slick and battery-efficient takes a concerted effort. When I decided to put Jacob’s Ladder on the Play Store, I prioritized reducing power consumption and maintaining a high frame rate.

On my Nexus 5 the frame rate goes as high as 100 frames per second and despite the number of vertices, after running for 20 minutes the battery usage remained below 1%:

 Black_cubes.gif Purple_cubes.gif

screenshot_20170204-174800
After running for 20 mins, battery usage is less than 1%

screen-shot-2017-02-04-at-3-01-07-pm
Average frame renders in 8ms

Screenshots of Jacob’s Ladder running on a Nexus 5, Marshmallow. 

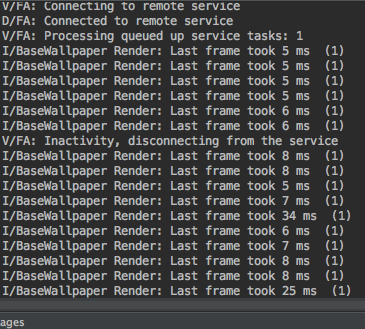
To efficiently render about 2000 vertices per frame requires a lean rendering pipeline. This pipeline starts at the Java Wallpaper class, runs through native (C++) code to the GPU, where it finally shows on screen. Any performance optimizations you make along this path will smooth out the rendering and ultimately improve the experience.

jni Continue reading “Making a Live Wallpaper in Native OpenGL”

Second Cup: The Graphics Pipeline

If you want to create amazing graphics, first find something that inspires you. You’ll need that motivation to push through the challenges you’ll face.

For the Second Cup project, we found something that inspired us: an interactive splash feature, a liquid simulation in a cup.

Screen Shot 2015-12-05 at 2.38.12 PM
Frame from an early concept design video.

It’s vital to understand the details of the Android graphics pipeline, from application code to display, if you want to create innovative graphics that’ll engage your audience.

Continue reading “Second Cup: The Graphics Pipeline”

Electroluminescent castle

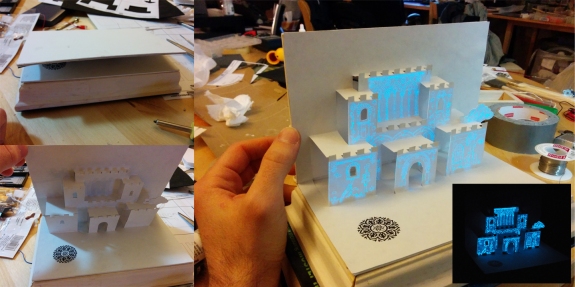
For Christmas this year I wanted to put together something unique and unprecedented for JB. This was an idea I’d had in my mind since I visited San Francisco about half a year ago. It’s a popup-book style castle that lights up in a seemingly impossible way.

Close, opening and the turned on state

There is no UV light. It’s lit from an internal source.  The design was conceived to be as compact as possible. It uses electroluminescent (EL) sheets discretely embedded inside the structure to create the illusion that the paper is glowing.  If you want to see how it was done, read on. Continue reading “Electroluminescent castle”

Switchboards

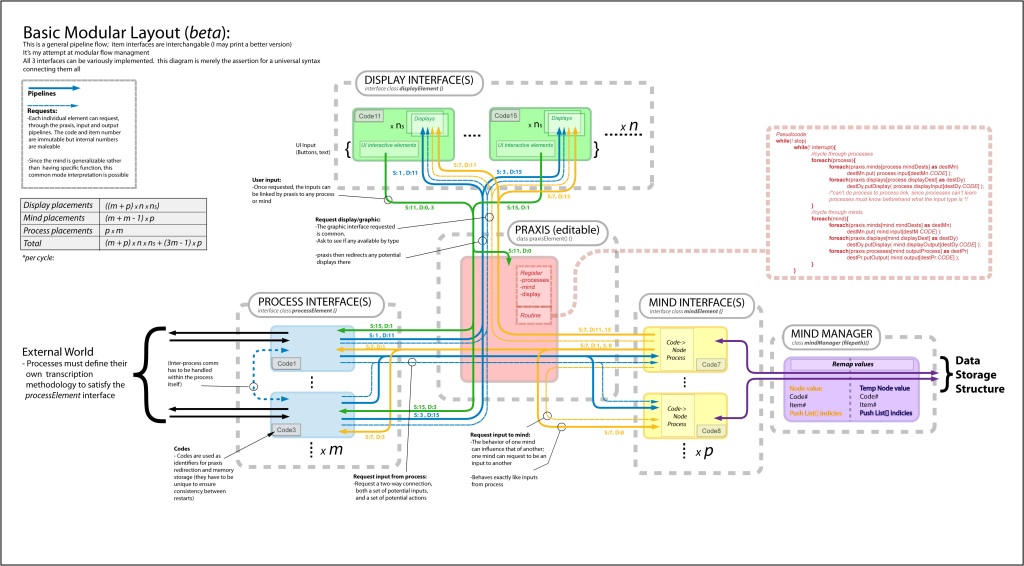
At a high level every program invents its own language (or architecture). The A.I. I’m working on is designed as a switchboard or routing system that can accommodate an indefinite number of additional components to be added to the larger community.  These are the component interfaces:

• Process: these are the input-output subsystems (for instance, vision, audition, actions, the spider depicted below, etc.)
• Minds: the actual A.I.s. They receive, store, and inter-compare input. They send actions to processes, and occasionally send information to other connected minds
• Displays: offer a library of standard pre-defined components. Any attached mind or processes can display relevant information or output through them.  The UI used below is one example of a generic display.
• Praxis: functions as a central switchboard for all connected parts.  It is the central messaging system which can route packets.


The praxis is depicted in the middle. It acts as pipeline control. The messaging system is currently serial, though it’s easily threaded.

Each element is identified by a GUID (globally standardized identifier), a unique code number (think Semantic Web).  This allows minds to remember prior relationships, correlates values, and even replace or upgrade one process with another of the same valence.  The valence of the target in relation to a given mind is built into the interface between mind and praxis, and would be defined by the mind during any request.

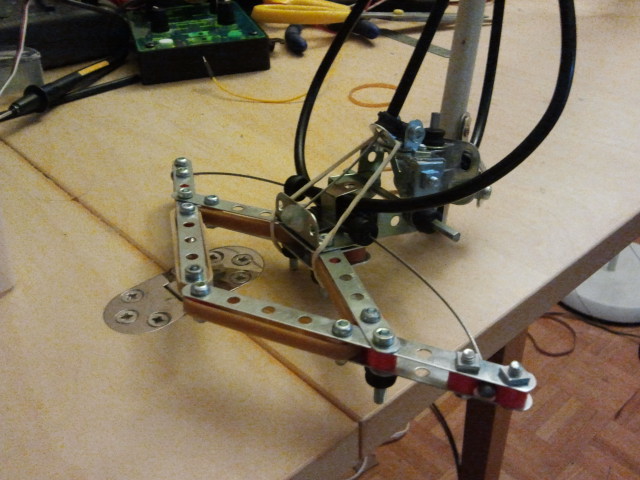
DIY arachnid legs

It’s exhausting figuring out the dynamics and statics and whatnot on a digital spider, so I decided to take a breather this morning to make a spider’s leg (four or more of these together => spider).  The Box2D spider is coming along, but it’s taking its sweet time, so to fill my time I’m:

Siders (and insects) have some of the simplest biophysics, since they generally have to cram as much capability (walking, jumping, climbing) into such a tiny body.  So, as engineers, we tend to favor spider and insect models as testing environments for new behavioral algorithms.  If it shows some success, we scale it up to something more challenging, like a beaver*.


Update: It’s been over three months since my last update to this thread, but since Meccano Inc. doesn’t provide replacement parts, my work had ground to a halt – (and this is why Meccano will never successfully compete with Lego).  As for the part itself, I need this:

Part A212 connector

I need 30 of these, and they cost 40 cents each.  I located three retailers, each of who failed to satisfy my Meccano needs.

*OK, not a beaver.  Well, not yet, anyways.

Why can’t blindfolded people walk in a straight line? My guess is: just math.

study from about 2 years ago addressed a question that had (apparently) perplexed scientists since the 1920s. It got public attention when it was featured on a recent episode of Q.I. The study confirmed that when blindfolded, the average person can’t walk in a straight line for any considerable distance.  I cam up with my own answer (illustrated below).  It’s simple, and I have provided a computer simulation to illustrate its empirical soundness.

When your subject is blindfolded and asked to proceed forward in a straight line, they will make every effort to stay on course. Unfortunately, each time your subject takes a new step, there will be minor errors/deviations. Some will be caused by the unevenness of terrain, others by random muscle fluctuations, or nervousness caused by walking blindfolded, etc.  Therefore, at any given step, the range of possible locations your foot will land can be represented by a thin wedge:

Wedge of possibility
‘Wedge of possibility’

Continue reading “Why can’t blindfolded people walk in a straight line? My guess is: just math.”

Cross-sensory adaptation could help the blind ‘see’

For almost three years now I’d been devoted to a private project whose purpose was to use micro-electronics to aid blind people to see in 3D.  To that end, I recently contacted the CNIB since, if anyone would be interested in funding such a project, it would be them.  They asked me to submit an abstract, and this is what I sent:


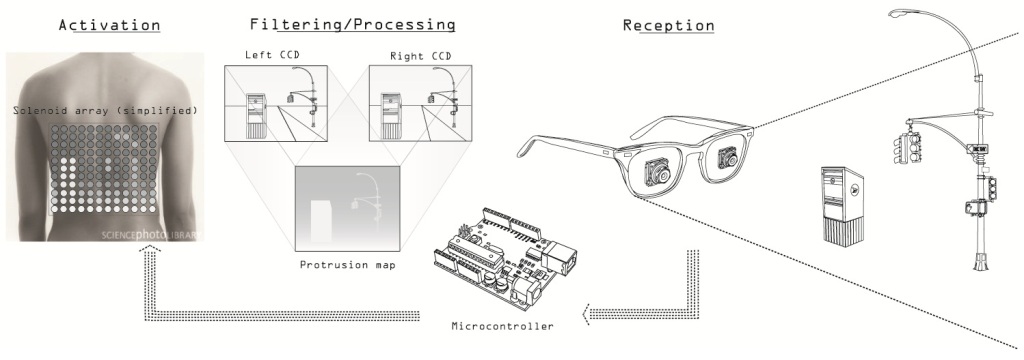
Spatial navigation using CCD cameras and mini-solenoids

One of the most crucial functions of vision is the ability to navigate through one’s environment, and its loss constitutes a significant impairment.  Much of the resources spent in aid of those with vision loss are directed towards compensating for its loss, for instance, the use of white canes or guide dogs.  The solution I propose, employing the use of CCD cameras, would significantly reduce these costs, increase navigational efficiency, and overcome many of the shortcomings of contemporary solutions.

Two small cameras placed inside the frame of a pair of glasses, each mounted with a fish-eye lens, would capture images of the surrounding environment.  Using an algorithm that compares hue and tone, we form a three-dimensional ‘protrusion’ image of the objects immediately in front of the user, as in the diagram above.  This protrusion map would represent the distances to these objects.  The information would then be conveyed to a 2D array of miniature actuators placed on the user’s back.  The points closer to the client in his visual field are denoted by a stronger pressure.

Individuals using these glasses will quickly adapt to use the tactile information in navigating their environment.  Human perception is plastic enough to ultimately integrate this information into day-to-day navigation, around obstacles, and in both open and enclosed spaces.


Edit: so, as it turns out, a company called Tyflos has been working on something similar.  Their prototype is not yet complete, but to be honest, I have no chance of competing with their million dollar budget. It’s a shame really, since I spent a lot of time working on the software to turn binocular vision into 3D. (Updated link).

Arachnophobia (part2)

The simulation seems to be going OK, I guess, except that every so often the spider gets catapulted into the air. 


Edit: Solving a four-chain Inverse Kinematics (IK) problem is proving tricky, so I turned to Box2D, an open source 2D physics simulation library. It can’t do IK, but I don’t need it to. On the plus side, it’s allowed me to add rocks and other physics obstacles.

Helping hand

I figured I had some time to kill while the digital spider was in training, so I toyed with this robotic arm.  The actuators are repurposed bicycle wires, and the rest is Meccano.

Close up of the hand

I don’t recommend this design.  It’s far to heavy, and has no precision.  Bicycle wires have some internal ‘give’, so your error margin will be pretty high for something that feels like it should be precise. It was mostly just for fun.

Arachnophobia

I’m developing a new simulation framework in order to create a simplistic spider-like creature (I started off calling it a ‘virus’ since the original design of the creature reminded me of the spindly legs on an RNA virus). 
This program generates a randomized terrain with dynamic rocks strewn along its surface, along which the spider can walk. 
It then took a foray through some obscure trigonometry trying to get the physics of the whole system to work.  The A.I. itself gets plugged into the backend input/output of the spider’s processor, and the switchboard class cordinates the A.I. with the needs of the spider creature.  Finally, all that’s needed now is to apply a simple spur to “motivate” it to scootch on over to the right, and through unsupervised conditioning it learns to take its first steps.

Symbols in the picture: The red/blue squares on the left hand side are how the spider sees the terrain around him (at two different degrees of resolution).  This is in fact the only way the spider can see.  It can feel the position of its limbs (proprioception), contact of its feet and limbs, and stress if its been putting too much effort (seen in the blue guage on the left). In all ways that it can be constrained, kinematically and dynamically, it has been: it can’t cross the ground, falls when unsupported and has restrictions on its own motion. 

So wsh him all the best, he’s going to need to to get across the terrain.

(If this works, it’s spider-fighting time)